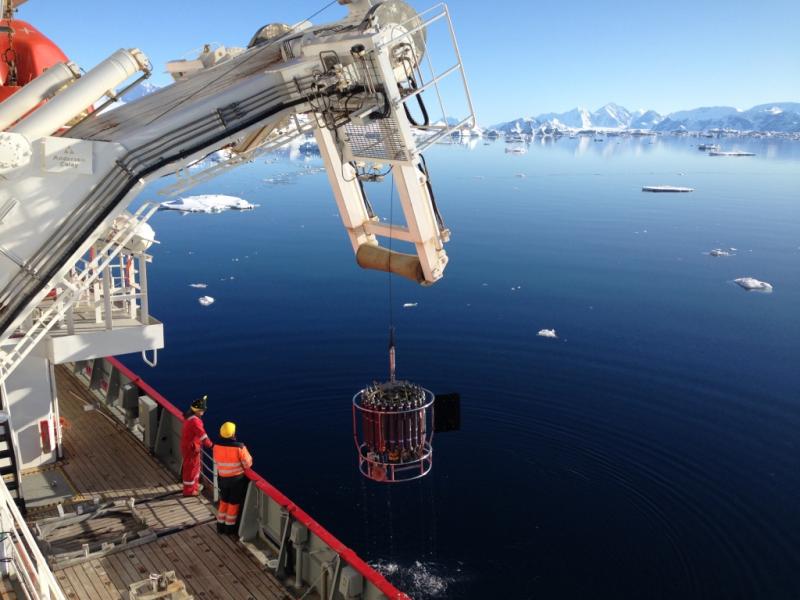
Research cruises and data
Since 1993, twenty-seven UK research cruises have made measurements on the SR1b line across Drake Passage, including twenty-four complete occupations of the section.
Data from these cruises are available from BODC, and processed, quality-controlled CTD and water sample data are also available from CCHDO. Links to specific cruise datasets are included in the table below. Data should be acknowledged using the following text: "Data were collected and made publicly available by the international Global Ship-based Hydrographic Investigations Program (GO-SHIP; http://www.go-ship.org/) with National Capability funding from the UK Natural Environment Research Council to the National Oceanography Centre."
Recent and upcoming cruises
2019/2020, DY113, 3 Feb - 13 Mar 2020, RRS Discovery. Principal Scientist: Yvonne Firing
2020/2021, DY126, Feb - Mar 2020, RRS Discovery. Principal Scientist: Yvonne Firing
If you are interested in participating in an upcoming cruise, please contact Yvonne Firing.
Completed cruises
Drake Passage repeat sections that have been occupied by the UK since 1993 are listed in the table below, with links to cruise reports and (where applicable) cruise blogs. For each cruise, links to the complete data inventory held by BODC and (where available) to processed hydrographic data held at CCHDO are included. The table also includes estimates of the volume transport and seasonally-adjusted transport-weighted mean temperature of water carried through Drake Passage by the Antarctic Circumpolar Current, computed as described here.
| Season | Start Date* | End Date* | Cruise Code | Outputs | Baroclinic Transport (Sv)** | Transport-Weighted Potential Temperature (°C)*** |
|---|---|---|---|---|---|---|
| 1993/94 | 21/11/1993 | 26/11/1993 | JR0a/JR00_1 | Report | BODC | Hydro | 134 | 2.22 |
| 1994/95 | 15/11/1994 | 21/11/1994 | JR0b/JR00_2 | Report | BODC | Hydro | 141 | 2.14 |
| 1995/96 | no cruise | |||||
| 1996/97 | 15/11/1996 | 20/11/1996 | JR16 | Report | BODC | Hydro | 125 | 2.18 |
| 1997/98 | 29/12/1997 | 07/01/1998 | JR27 | Report | BODC | Hydro | 146 | 2.21 |
| 1998/99 | no cruise | |||||
| 1999/00 | 12/02/2000 | 17/02/2000 | JR47 | Report | BODC | 143 | 2.33 |
| 2000/01 | 22/11/2000 | 28/11/2000 | JR55 | Report | BODC | Hydro | 142 | 2.22 |
| 2001/02 | 20/11/2001 | 26/11/2001 | JR67 | Report | BODC | Hydro | 132 | 2.14 |
| 2002/03 | 27/12/2002 | 01/01/2003 | JR81 | Report | BODC | Hydro | 134 | 2.04 |
| 2003/04 | 11/12/2003 | 15/12/2003 | JR94 | Report | BODC | Hydro | 145 | 2.26 |
| 2004/05 | 02/12/2004 | 08/12/2004 | JR115 | Report | BODC | 127 | 2.07 |
| 2005/06 | 07/12/2005 | 12/12/2005 | JR139 | Report | BODC | 133 | 2.23 |
| 2006/07 | 08/12/2006 | 12/12/2006 | JR163 | Report | BODC | 127 | 2.20 |
| 2007/08 | 30/11/2007 | 05/12/2007 | JR193 | Report | BODC | 135 | 2.16 |
| 2008/09 | 13/12/2008 | 18/12/2008 | JR194 | 131 | 2.29 | |
| 2008/09 | 20/02/2009 | 26/02/2009 | JC031 | Report | BODC | Hydro | 133 | 2.33 |
| 2009/10 | 19/11/2009 | 26/11/2009 | JR195 | Report | BODC | Hydro | 115 | 2.01 |
| 2010/11 | 01/12/2010 | 17/12/2010 | JR242 | | BODC | incomplete | |
| 2010/11 | 21/04/2011 | 25/04/2011 | JR276 | Report | BODC | incomplete | |
| 2011/12 | 28/11/2011 | 05/12/2011 | JR265 | Report | BODC | Hydro | 132 | 2.14 |
| 2011/12 | 07/03/2012 | 11/03/2012 | JC069 | Report | BODC | incomplete | |
| 2012/13 | 18/03/2013 | 27/03/2013 | JR281 | Report | BODC | Hydro | 134 | 2.03 |
| 2013/14 | 12/03/2014 | 02/04/2014 | JR299 | Report | BODC (I), (II) | 147 (discontinuous) | 2.12 |
| 2014/15 | 13/01/2015 | 18/01/2015 | JR306 | Report | BODC | Hydro | 159 | 2.20 |
| 2015/16 | 06/01/2016 | 12/01/2016 | JR15003 | Report | BODC | Hydro | 121 | 2.05 |
| 2016/17 | 08/11/2016 | 05/12/2016 | JR16002 | Report | BODC | Hydro | 130 | 2.28 |
| 2017/18 | 15/12/2017 | 18/12/2017 | JR17001 | Report | BODC | 130 (missing northern slope) | 2.48 |
| 2018/19 | 03/11/2018 | 21/11/2018 | JR18002 | Report | BODC | 135 | 2.16 |
| 2019/20 | 03/02/2020 | 13/03/2020 | DY113 |
*start and end date of measurements
**relative to deepest common level (reference level varies from occupation to occupation); 1 Sv = 1 million cubic metres per second
***transport-weighted mean potential temperature seasonally adjusted to December