Research and impact
Latest results
The most recent Extended Ellett Line cruise took place in May 2017.
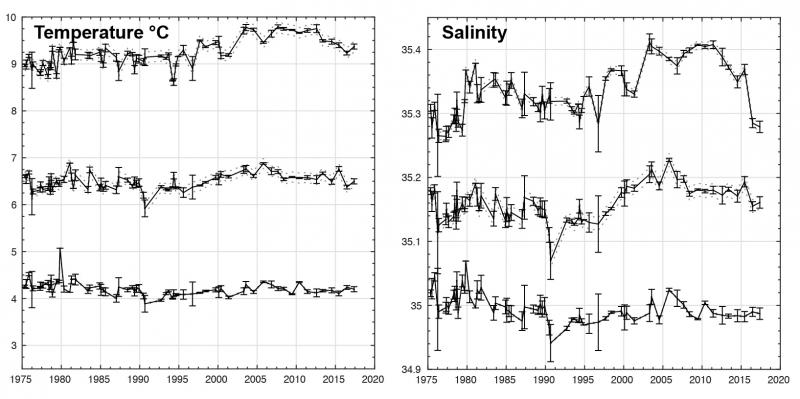
The pattern of change over time in temperature and salinity in the Rockall Trough is shown in this figure. We've divided the ocean into three layers: the top line is the uppermost layer which is about 800m deep; the middle line is an intermediate layer with a high gradient of temperature, salinity and density ("the thermocline", about 800-1200m deep); and the bottom line is the deepest and densest layer of the ocean, here about 1200-2300m deep.
Each occupation of the Extended Ellett Line is shown by a black dot to represent the average temperature and salinity of that layer at the time of the measurements. The vertical error bars give an indication of the spread of temperature and salinity recorded that year, and the thin dotted line gives us an estimate of how well our data represent the average over a whole year.
Impact and advice
Extended Ellett Line data and research are used in climate assessments by the Intergovernmental Panel for Climate Change (IPCC), the UK Marine Climate Change Impact Panel (MCCIP), DEFRA, the International Council for the Exploration of the Sea (ICES), Marine Scotland Science, and the OSPAR Commission.
Stories of extreme weather and waves encountered during Extended Ellett Line cruises form a popular entry point for media stories about the science of the programme. The Extended Ellett Line has featured in many articles, TV programmes and books (including a New York Times bestseller).
